Difference between revisions of "Micro to Macro Water Pollution"
Hammer dirt (talk | contribs) (→Aims) |
Hammer dirt (talk | contribs) |
||
| Line 1: | Line 1: | ||
| − | Community based environmental monitoring has been proven effective in a variety of fields, water quality monitoring by volunteers is in wide practice across North America. Four Swiss nonprofit associations | + | Community based environmental monitoring has been proven effective in a variety of fields, water quality monitoring by volunteers is in wide practice across North America. Four Swiss nonprofit associations use visible pollution inventories, microbiological monitoring and chemical analysis by combining classic labratory techniques and the use of innovative bio-reporters develo to expand the capabilities of community based environmental monitoring.<br> |
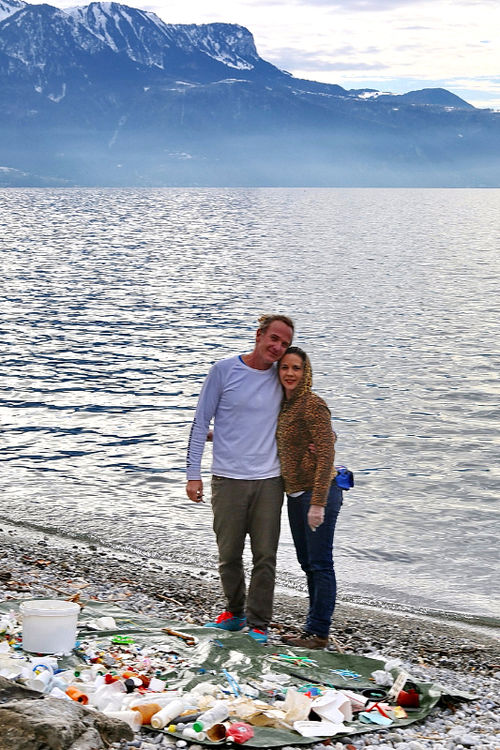
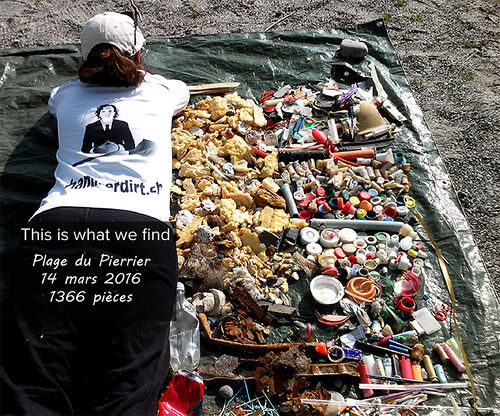
[[file:Sortingdebris.jpg|thumb|500px|right| hammerdirt team sorting debris at Vevey, Jan 2016. Source: MCBPII]] | [[file:Sortingdebris.jpg|thumb|500px|right| hammerdirt team sorting debris at Vevey, Jan 2016. Source: MCBPII]] | ||
Revision as of 10:08, 15 May 2016
Community based environmental monitoring has been proven effective in a variety of fields, water quality monitoring by volunteers is in wide practice across North America. Four Swiss nonprofit associations use visible pollution inventories, microbiological monitoring and chemical analysis by combining classic labratory techniques and the use of innovative bio-reporters develo to expand the capabilities of community based environmental monitoring.
Background Information
Hammerdirt came to the BIO-DESIGN for the REAL WORLD's Winter School with data on the macropollutants washing up on the local beaches in and around Montreux (CH). The data format conforms to international norms, and over two years, some patterns can be observed in the level of litter on the shores. The collaboration will be an exchange and complement to what is already on-going at Hammerdirt.
The presentation can be found here: How can we work together ?
Aims
To effectively integrate more advanced and innovative water quality monitoring techniques to classic community based environmental activites.
Brainstorm Results
At Open Hackuarium #88, we came up with some initial ideas.
- Data Analysis
- Image analysis and machine learning to readily tabulate the macro-pollutants collected on the beach
- synching the above data with a phone application in the internationally accepted format
- Add lake existing data (lake current, meterology, etc.)
- Water collection and Analysis
- Standardizing Collection Methods
- Water chemistry testing - turbidity, pO2, pH, conductivity, temperature
- DIY free NH2
- Microparticle counting - DIY
- Heavy metal analysis DIY equipment of BIODESIGN to be more robust - or
- Make a fluorescent plate reader for higher throughput (CAUTION: still need P1 to use bioreporters here)
- antibiotic resistant bacteria (CAUTION: we cannot amplify/concentrate possible pathogens)
- Fish diseases - ask Maison de la Rivière?
- Awareness Raising - Recycling
- Recycle plastics using the extruder and use it to 3D print objects
- Biodegradation with mycelium
Collaboration Defined
| Partner | Role |
|---|---|
| ACTION FOR GENOMIC INTEGRITY THROUGH RESEARCH! | Technical oversight for the microbial assays, training of hammerdirt staff, quality control of laboratory operations and of sample processing and analyses. |
| HACKUARIUM | Laboratory infrastructure and security, testing equipment and supplies for biologicals |
| HAMMERDIRT | Collection and processing of samples, data storage and administration. Communication of analyses and results. |
| BIODESIGN.CC | Analysis of samples for mercury, Cadmium Zinc, Alkanes and arsenic using the bio-reporters |
Water Quality and Analysis
Spring and Summer 2016
Introduction
One of the benefits of a “Community Based Environmental Monitoring” (CBEM) project is to expand the monitoring capacity of government agencies and engage the public in environmental stewardship. In response to questions from the public and our own professional curiosity we have decided to initiate a limited CBEM project (1) (2) .
As part of the Montreux Clean Beach Project II(MCBPII), a water quality testing (WQT) program is being initiated at selected sites of the MCBPII. Symptoms reported by members and frequent bathers in the lake during previous summer seasons have sometimes been attributed to low bathing water quality, influenced by increased anthropogenic pressure of lakefront activities during certain times of the year. This year's WQT aims to gather microbiological data over a six week period in order to test this hypothesis.
Meetings at “La Maison de la Rivière” and the “Institut National de Recherche Agronomique” support the idea that the WQT information proposed is not regularly collected at the Haut-Lac locations covered by the MCBPII.
Objectives
CBEM programs are designed to educate the public, involve local citizens in environmental stewardship and provide reliable data for government and other interested organizations. In this regard the MCBPII CBEM program is no different than that of any other existing project. (2)(3)(4)(5)(6)
Specifically, the goals for this project are to:
- Collect reliable water quality data as defined by the World Water Monitoring Challenge
- Collect and enumerate the quantity of key bacteriological indicators, in particular those related to fecal contamination
- Increase the skills of hammerdirt staff in regards to collecting and processing water samples.
- Make the obtained data free and open to use for all concerned
- Inform the public about affordable and simple water monitoring techniques
- Inform the public of community based resources designed to advance scientific literacy
More information CBEM Network
Deliverables
The objectives of a CBEM are designed to increase the monitoring capacity of current public systems and provide reliable, accessible data for the public and other government researchers. Data gathered from this project will be reported with our regular activity reports and the raw data will be available for download within 72 hours of the testing date from our repository on Github or through the KoboToolbox for the location in question. This document along with sampling protocols and all other supporting documents will be available on the wiki.
Weekly results will be furnished to the CIPEL, SIGE and INRA:
- Location and number of tests
- Results of tests completed for the week
An end of project report will be published in PDF format, available for interested parties, and include:
- Summary statistics and findings
- Graphs/plots
- Map overlay with densities and values
- Comparison with government supplied data (if available)
- Discussion of limitations and possible improvements to future CBEM projects
More information KoboToolbox
Testing Materials
Heavy Metals
Bioreporters, designed and fabricated by biodesign.cc will be used to test for Alkanes, Arsenic, Mercury and Cadmium/Zinc.
What are bioreporters ? Get some background information here
Turbidity, temp, DO and PH
Testing materials and supplies will be procured from the World Water Monitoring Challenge an international program managed by the International Water Association and the Water Environment Federation.
Assembled and sold by Lamotte company as a “basic test kit,” each kit includes one set of hardware and enough reagents to conduct up to 50 rounds of testing for pH, dissolved oxygen, temperature, and turbidity. Included are:
- Instruction booklet
- Sample collection jar
- PH test tube
- Dissolved oxygen vial
- Secchi disk decal
- Temperature strips (14-40°C and 0-12°C)
- 50 pH reagent tablets (enough for 50 tests)
- 100 Dissolved oxygen reagent tablets (enough for 50 tests)
- Color chart for determining DO, pH and turbidity test results
Microbiological Analyses
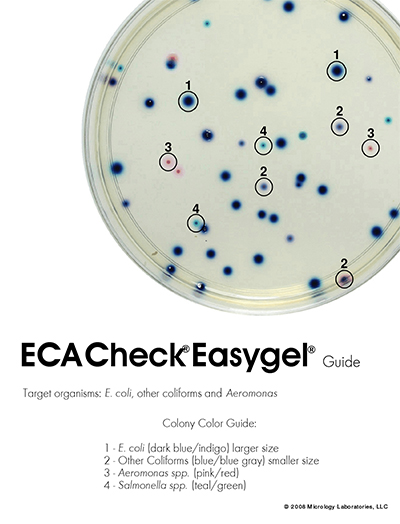
Presence and quantity of E.coli, other coli forms, Salmonella and Aeromonas will be tested using ECA Check Easygel. Easygel was first approved for Water Watch volunteer monitoring programs in the USA in 1999. A study released in 2009 compared the results of “Easygel” and “3M Petrifilm” used by volunteers to the results of laboratory analysis. Both methods had an overall accuracy rate above 80%. One big benefit of the Easygel format is that environmental samples of up to 5ml can be readily plated, with no worries about having to melt (and cool down!) agarose as used in standard microbial plates.(7)(8)(10)(14)
Members of the Hackuarium laboratory have used “Easygel” in previous educational activities, thus facilitating the training of hammedirt staff and volunteers.
Sampling Methods
Water samples will be taken just below the surface (0.5m) and collected in sterile containers with a secure, air-tight lid.
Advantage: simple and inexpensive, an important consideration to a program on a budget. It also does not require any special sampling apparatus. The volunteer holds a sampling container under the surface of the water, expells visible air bubbles, and closes the container under the water (to avoids losing dissolved gasses, particularly important if testing for volatile analytes).
Disadvantage: vertical gradients of temperature, oxygen, nutrients, and algae may be missed in these near surface samples. Deep lakes have a thermal gradient in the summer, and Lac Leman has at least two thermal regions (and, possibly, at least two chemical regions as well). Even in shallow, usually well-mixed lakes, chemical gradients will develop during calm periods.
Sampling methods by other CBEM projects : Stepenuck et all PDF, Fact Sheet Volunteer Water Monitoring, SOP Moore Creek E.coli sampling PDF, Texas Sampling PDF
Heavy Metals
Two samples of 250ml will be taken and transported to the hackuarium for later analysis. One sasmple will be acidified to fix the heavy metals in solution.
Turbidity, temp, DO and PH
One sample will be taken using the container supplied with the testing kit and processed immediately.
Microbiological samples
Three independent samples will be taken from each designated site in 15ml conical tubes pre-labeled in the following manner:
- Location
- Date
- Sample number for that day and location
- Time of sample
Once collected, the samples will be placed on ice and transported to the facility at Renens for plating on the ECA Check plates within 6 hours. Label information will be recorded in the field notes and the “KoboToolBox” for that sampling date and location.
Processing samples and recording results
Turbidity, temp, DO and PH
The instructions provided with the kit will be followed and the results will be noted in the field manual and entered into the “KoboToolbox” form for that sampling date and location.
Microbiologicals
One petri dish per sample will be labeled in the same manner as the sample container with the addition of the quantity of sample added to the media. A 1-5ml of sample water will be mixed into the provided gel media solution, plated and incubated for about 18 hours at the Hackuarium facility in Renens.
After incubation, plates will be scored, counting total colony forming units (CFU), and each identifiable species (E. coli CFUs will appear dark blue, other coliform CFUs will appear lighter blue-gray or blue-violet, Aeromonas spp. will appear as pink to very light pink, and Salmonella spp. will appear as light green colonies). Data will be reported as CFU/100ml of sample.
With values from three independent samples at each site, means and standard errors can be used to test significance of the obtained data over the course of the sampling period.
Locations
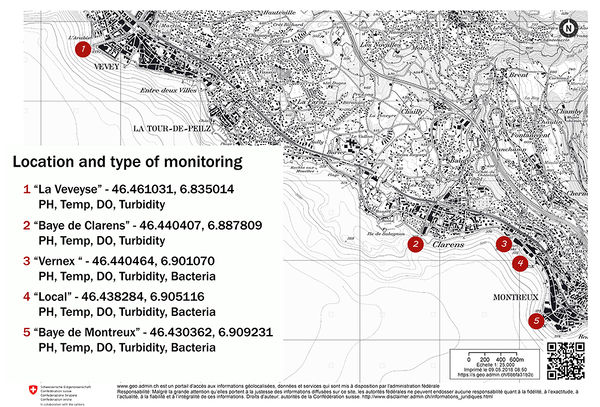
Three of the five locations are currently part of the MCBPII beach-litter-survey project. Point 4 will be added to the beach litter survey by using a net to catch visible pollutants on the water surface below the boat dock. Point 3 will only be monitored for chemistry and biologicals. Correlations of the test results with the physical location of the sampling will be of great interest.
To see a map of the locations that benefit from regular water quality monitoring : Eau de baignade
Testing Schedule
Calendar from biodesign.cc to be embedded here
key dates to be defined :
- Training for sampling and plating
- Event public demonstration of sampling and plating
- Start date for chemical samples
- Start date for microbiologicals
- Event public discussion of results, improvements and future projects
Microbiologicals
Testing will begin about 20 June 2016, and weekly samples will be taken from locations 3, 4 and 5. A 'negative control' sample will also be obtained each week from a local drinking fountain (labelled 'eau potable'). A positive control from an urban river (like the Vuachère or other) is also possible.
If a Tuesday afternoon testing protocol is followed over 7 weeks, the timeline would run from 21 June -2 August, require 21 sterile 15ml conical tubes for the water sampling, and 21 ECA Check EasyGel plates per site. After including a single 'negative control' for each sampling day, this will require 70 plates.
In case there are too many bacteria to count (TMTC) from certain samples, samples will be saved at 4oC and further dilutions can be also plated and scored.
Turbidity, temp, DO and PH
Testing will begin on the Tuesday or Thursday the week the kits are received (late May). The kit contains enough reagents to conduct 50 tests, thus allowing us to monitor the locations for 10 weeks. Data will be carefully recorded, digitized and analyzed.
Field Blanks
Field blanks are used to assess potential contamination from sample handling, airborne materials, equipment, media, and other sources. A field blank usually consists of a sterile diluent sample of 2 mL that is taken to the site and poured into a properly labeled sample container during the first bacteria sampling event of that day. The blank sample is collected in the same type of container, labeled as a field blank, and handled and analyzed along with all the bacteria samples collected on that day. It is used to identify errors or contamination in sample collection and analysis.
Data
Handling and storage
The addition of water quality testing will require changes in our digital form and reporting methods. The form currently used by surveyors will change, thus separating the data in two sections, one section prior to WQT and one after. Data for the two sections will have to be merged prior to any analysis. The results of bacterial testing will be available 48-72 hours after sampling, thus adding another step to the survey. This should not, however, change the availability of the other survey results which is currently 24 hours after each survey.
Data analysis and presentation
The existing data set for MCBPII includes visible pollution surveys, hydrologic and meteorological data. With the addition of microbiological and basic water chemistry a more complete picture of the environmental status of the locations in question can be established.
Two interpretations of the microbiological data will be used: the geometric mean and the 95th percentile. The geometric mean is in common use in North America and the 95th percentile method conforms to EU directive 2006/7/EC. Furthermore, any publicly available water quality data in the area will be presented and integrated where appropriate.
The relationship between the results of WQT and the quantity and type of visible pollutants will be explored.
How is the water currently monitored and evaluated ? Here is the source document from the Swiss Confederation Eaux de baignade
References
Sampling and Analysis in Community Based Environmental Monitoring
- Assessing the performance of volunteers in monitoring Streams. Fore, Leska, Paulsen, Kit and O'Laughlin, Kate. Bellvue, WA : Blackwell Science, 2001, Fresh Water Biology. Fore et all pdf
- Volunteer environmental monitoring and the role of the universities : The case of Citizens Environment Watch. Savan, Beth, Morgan, Alexis and Gore, Chritopher. Toronto : s.n., June 2003, Environmental Management, Vol. 31, pp. 561-568. Savan et all PDF
- Nicholson, Emily, Ryan, Jane and Hodgkins, David. Community Data – where does the value lie? Assessing confidence limits of community collected water quality data. Victoria : Waterwatch Victoria c/o Department of Natural Resources & Environment, 2002. Nicholson et all PDF
- A review of citizen science and community-based environmental monitoring: issues and opportunities. Conrad, Cathy and Hilchey, Krista. [ed.] Springer. Halifax, Nova Scotia : s.n., 2010, Environ Monit Assess, pp. 273-291. Conrad & Hilchey PDF
- World water monitoring challenge. Instructions. Geneva : World water montioring Challenge, 2015. Instructions for the water monitoring test kit provided by the world water monitoring challenge. Instructions for PH, DO, temp and turbidity PDF
- World Health Organization. Guidelines for safe recreational water environments. Geneva : World HEalth Organization, 2003. Vol. 1 Coastal and Fresh Waters. WHO Guide Lines
- Texas Stream Team Volunteer Water Quality Monitoring. E.coli Monitoring and Analysis Procedures. 2010. Texas Sampling PDF
- Stepenuk, Kristine, et al. Volunteer monitoring of E. coli in streams of the upper Midwestern United States: a comparison of methods. [ed.] University of Wisconsin—Extension. Madison : Springer, 2010. Stepenuck et all PDF
- Myers, D.N., et al. Fecal indicator bacteria (ver. 2.1). [book auth.] U.S. Geological survey. U.S. Geological Survey Techniques of Water-Resources Investigations. 2014, Vol. book 9, chap. A7, section 7.1. Myers et all PDF
- Iowa Department of Natural Resources, Geological Survey. Citizens Monitoring Bacteria. Iowa City : s.n., 2005. Vols. Water Fact Sheet 2005-1.Fact Sheet Volunteer Water Monitoring
- Arizona Department of Environmental Quality Water Quality Improvement Grant Program. Writing Effective Monitoring Plans. s.l. : Arizona department of environmental quality, 2008. TM 08-04. Guide to writing a sampling plan PDF
- USEPA REGION 9 LABORATORY. STANDARD OPERATING PROCEDURE FOR VOLUNTEER MONITORING OF SURFACE WATERS FOR BACTERIA. Richmond : United States Environmental Agency, 2007. SOP Volunteer monitoring PDF
- U.S. Geological Survey. National Field Manual for the collection of water quality data. 2006. Vol. Book 9. http://water.usgs.gov/owq/FieldManual/
- Wolfson, Dr. Lois. E. coli Monitoring – Effective Techniques and Test Kits for Volunteers. Michigan Clean Water Corps Conference. s.l. : Michigan State University, October 16, 2007. Test Kit Presentation PDF
- Epstein, Charlotte. KNOWLEDGE AND POWER IN GLOBAL ENVIRONMENTAL ACTIVISM. s.l. : International Journal of Peace Studies, 2005. Epstein PDF
- CH. Loi fédérale sur la protection des eaux. [Online] juin 1, 2014. https://www.admin.ch/opc/fr/classified-compilation/19910022/index.html#a4.
- Kleehammer, Katie and Sigler, Adam. Moore Creek Volunteer Monitoring for Escherichia coli - Sampling and analysis. Bozeman : MSU Extension Water Quality, 2012. SOP Moore Creek E.coli sampling PDF
- Homogeneous Distribution of Escherichia coli Measured within the Vertical Water Column of Small, Freshwater Streams. Buckalew, David, et al. Farmville, VA : Scientific Research Publishing, March 24, 2014, Water Resource and Protection, pp. 410-421. Buckalew et all PDF
- Micrology LAboratories. Easy Gel Method Procedure. Goshen, Indiana : s.n., 2015. Recomended procedures for chromogeinc media. Procedure Easygel PDF
- Micrology Laboratories. ECA Check Easy guide. Goshen : Manufacturers color guide for chromogenic media. ECA guide to determining bacteria PDF
- DIRECTIVE 2006/7/EC concerning the management of bathing water quality. European Union. Strassbourg : s.n., 2006, Official Journal of the European Union. Directive 2006/7/EC
- Canfield, Daniel; Hoyer, Mark; Volunteer Lake Monitoring : Testing the Reliability of Data Collected by the Florida LakeWatch Program: Lake and Reservoir Management-March 2002 Reliability of volunteer data PDF
Documents from hammerdirt Clean Beach Projects
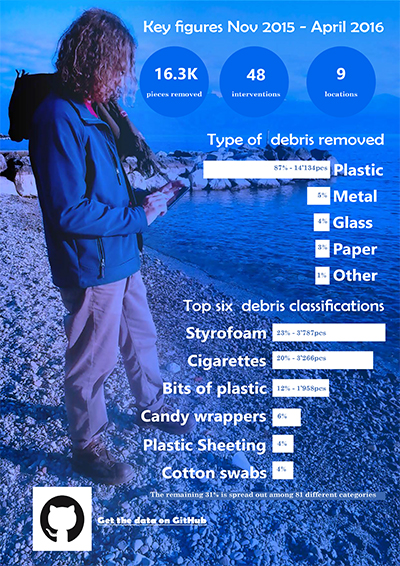
- Activity report Nov 2015 - April 2016
- Pilot project CBEM May 2016
- Hammerdirt Clean Beach Project 2 2015 Draft
- Comparison of Lake Geneva beaches to other OSPAR regions
- Citizen Science and litter studies (french)
- MCBPI 2014-2015 results (French)
- MCBPI 2014-2015 results (English)
Literature
2014 Report on Leman biomass
2014 Physico-chemical Leman report
Relevant Links
Discard Studies publishes interesting articles on Water Pollution
- Pharmaceuticals Out of Bounds - conference coming up in 2016
- DIY Plastics Collector "Babylegs"
- Redefining pollution and action - article
Electronic Lab Notebooks
- A universal open-source Electronic Laboratory Notebook Bioinformatics 2013 29(13):1710-2. doi: 10.1093/bioinformatics/btt253
Press
Documentation and Collaboration Tools
Agree on documentation and collaboration tools
- Internal communication - hackuarium slack
- Calendar? - we have a biodesign google calendar
- Protocols - [1]?
- Electronic Lab Notebook - [2]? - a template system where people can write down what they do would be nice, should it be the same as the Data entry format where you comment on unusual procedures or events?
- Data entry and sharing - Hammerdirt github, compliance with the international standards
- Hardware design - biodesign github
Water Collection Protocols
Coliform Bacteria Counting
Coliform bacteria is an indirect indication of fecal contamination of the waters. There are several methods to distinguish coliform bacteria vs other microorganisms that may grow on an agar plate.
Easy Gel
Micrology Labs Coliscan Easygel
- Rachel asked for an offer including shipping and the 15% discount for the a coliform bacteria testing medium.
- reminder request sent again 18 April to Jonathan Roth (CEO of Micrology Labs) and Doug Wengerd (who eventually answers notes to their 'info' address)
Protocol from the Micrology Labs
To note: the Micrology Lab ECA Easygel plates are more expensive, but can assay up to 5ml of sampled water per plate for ready scoring and disposal. Another currently proposed plate media would not only be less discriminating, but require more equipment for the sterile setup and final cleanup, and probably only allow 0.5ml to be assayed/plate.
Other Media
- Endo agar where gram negatives are favored to grow. Fermentation of lactose in the medium by coliform bacteria gives metallic green sheen to those colonies.
- MacConkey agar - also contains lactose and neutral red as a pH indicator, bile salts to inhibit gram-positive bacteria growth
- MacConkey agar with sorbitol is used to isolate E. coli O157, a pathogenic enteric bacteria
- Eosin Methylene Blue agar - Lactose fermenting bacteria turn a dark color, gram positive bacteria also inhibited
DIY protocol
Automatic Colony Counter and Plate Counting
This is not a DIY gel, but ENDO agar was used for the workshops Lifepatch conducted in Indonesia: Quantification of e. coli contamination in water
From Lifepatch, we have set this up DIY automatic colony counter.
Other Methods
- Good "travaux pratique" protocol for bacterial counting and salts concentration from Bioutils, UNIGE
- Other protocol proposing several direct and indirect methods
Biodesign has tried:
- Hack-a-Taq
- This early post has a pdf at the end summarizing techniques, including portable sensor, paper strip, etc.
Scaling
Basic calculation for cost for one time analysis:
- number of plates = number of sites x number of dilutions x number of replicates + positive control + negative control
Use glass petri-dishes for recycling - we can as Lifepatch how they set it up.
Community Bioreporter Kit for Switzerland
- Our current prototype needs to be field-ready - the final design parameters need to be discussed.
- The protocol for the bioreporter assay needs to be simplified.
Otherwise, the system for working with the bioreporters has been approved with the Swiss authorities.
Water Multi-meter
- (Art)ScienceBLR
- Student Project 2016
